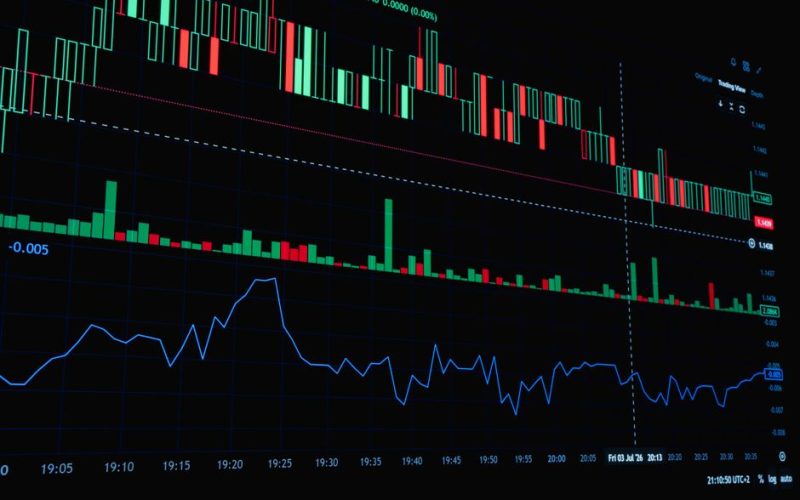
Bullish reversal chart patterns signal potential shifts in market sentiment from bearish to bullish. Technical analysts monitor these formations to identify optimal entry points when downward trends lose momentum. Understanding these structures allows market participants to evaluate risk more effectively without relying on speculative forecasts. Whether tracking equities, commodities, or currencies, recognizing these visual cues helps traders map out structural changes in supply and demand. This article explores five foundational formations that frequently appear across various timeframes and asset classes.
Bullish reversal chart patterns: 1. The Inverse Head and Shoulders
The inverse head and shoulders pattern is one of the most reliable bottoming formations in technical analysis. It consists of three successive troughs, where the central trough dips deeper than the outer two. The left shoulder forms as the initial selling pressure exhausts itself. A subsequent recovery leads to a higher low, creating the head. The right shoulder mirrors the left, establishing a balanced psychological floor. Volume typically contracts during the formation of the head and expands during the breakout above the neckline. Analysts watch this neckline closely as the critical threshold for confirming trend reversal.

2. The Double Bottom
A double bottom resembles the letter W and occurs after an extended price decline. The asset price drops to a support level, experiences a modest relief rally, and then falls back to test that exact same support level. This second test confirms that sellers lack the conviction to push prices lower. The confirmation of the pattern happens when the price breaks above the peak of the intervening rally between the two lows. Market participants often measure the distance from the bottom to the peak and project it upward to estimate potential price targets following the breakout.
3. The Falling Wedge
A falling wedge forms when an asset’s price consolidates within converging downward-sloping trendlines. Unlike a descending channel where parallel lines define the slope, a wedge contracts as the range narrows. This contraction indicates that selling momentum is decelerating even as lower prices are reached. Buyers step in gradually, preventing steeper declines. A decisive breakout above the upper trendline signals that buyers have regained control, frequently triggering rapid upward movement as short positions are covered and new long positions are initiated.
4. The Rounding Bottom
Also known as a saucer bottom, the rounding bottom represents a long-term price consolidation that traces a U-shape on the chart. This formation reflects a gradual transition in market psychology from widespread pessimism to cautious optimism. Trading volume often mirrors the price action, declining during the descent into the base and increasing as the price climbs toward the previous resistance level. Because this pattern develops slowly over extended periods, it is frequently observed on daily or weekly charts rather than intraday timeframes.
5. The Bullish Cup and Handle
Popularized by market historian William O’Neil, the cup and handle pattern resembles a teacup on a chart. The cup forms a rounded bottom after a market correction, displaying a U-shape as buying interest slowly returns. Following the right rim of the cup, a small downward-drifting consolidation forms the handle. This handle represents a final minor shakeout before the primary upward trend resumes. Volume typically dries up during the formation of the handle, followed by a surge in volume when the price breaks out above the resistance line of the cup.