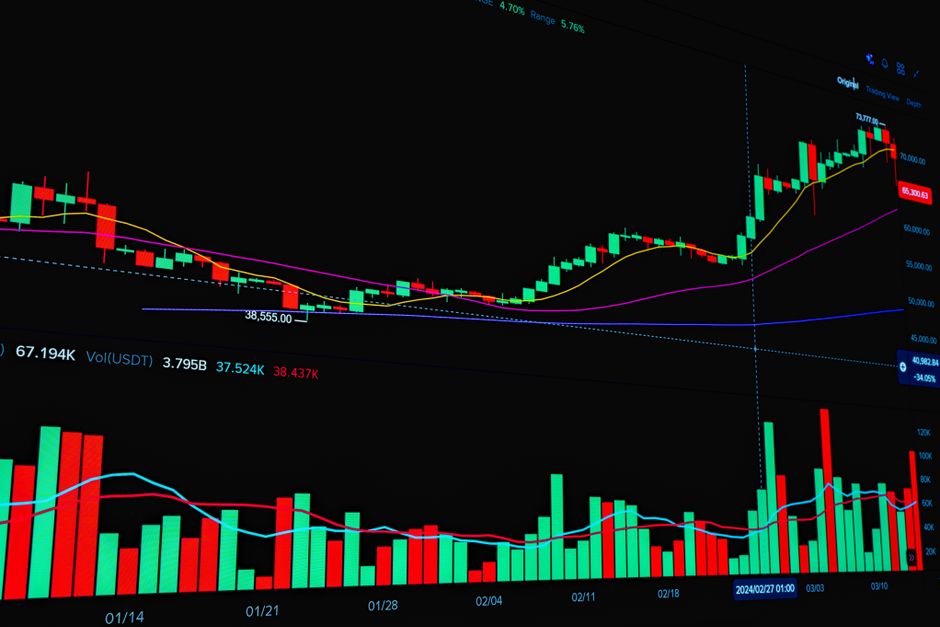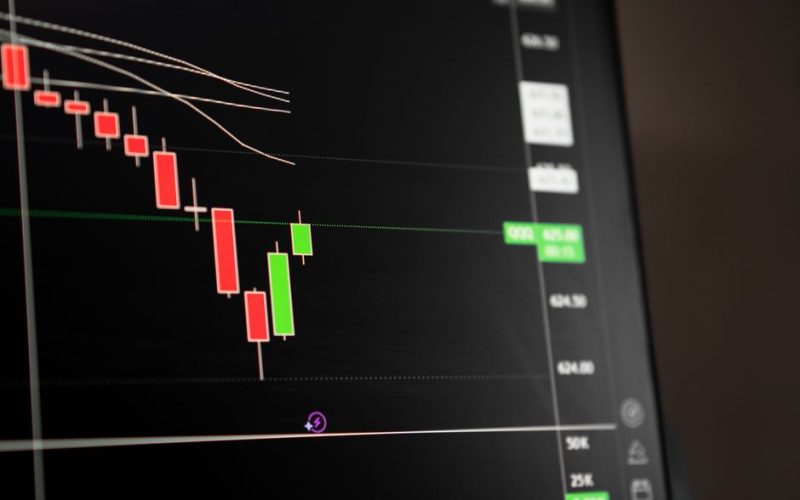
Moving average crossover strategy remains a foundational technique for traders analyzing market momentum. By plotting two different average lines on a price chart, participants can spot potential shifts in market direction. Whether you trade equities, currencies, or commodities, understanding how these lines interact helps build a structured technical framework. This tutorial explores the core mechanics behind crossing lines, setup prerequisites, and practical execution steps to enhance your analytical process without relying on guaranteed outcomes.
Understanding Moving Average Crossover Strategy Mechanics
At its core, a moving average smooths out price data to form a single flowing line. The primary concept relies on combining a short-term indicator with a long-term indicator. When the short-term line crosses above the long-term line, it often suggests rising momentum. Conversely, crossing below may indicate declining momentum. Traders study these intersections to gauge the prevailing market direction before executing analysis.
Prerequisites Before Applying the Strategy
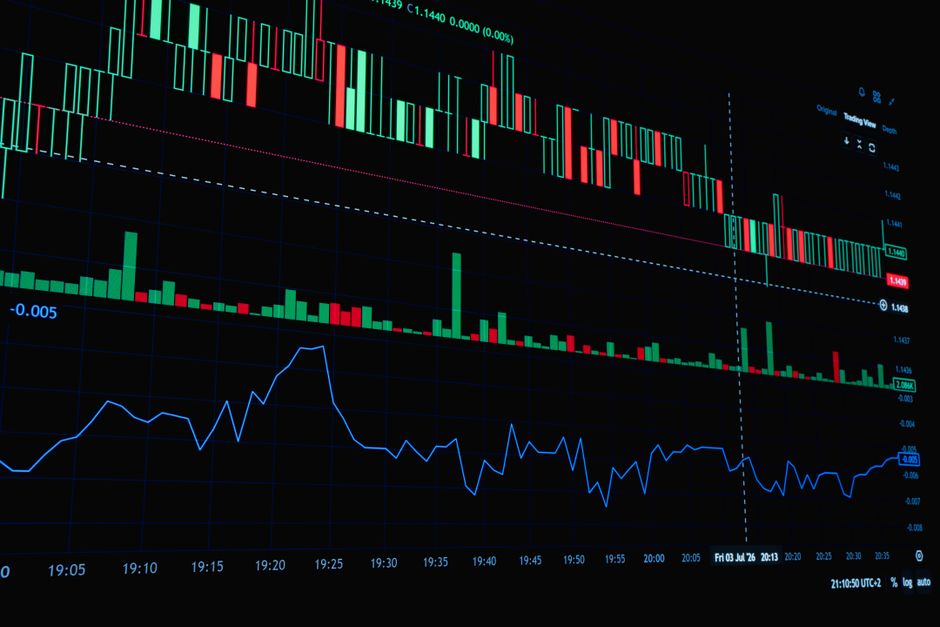
Before applying technical indicators, establishing a reliable charting platform is essential. Traders should select appropriate timeframes that align with their analytical goals, such as daily or hourly charts. Additionally, defining risk parameters and understanding market volatility are critical prerequisites. Without proper preparation, interpreting line intersections can lead to false signals in choppy market conditions.
Step-by-Step Implementation Guide
First, open your charting software and attach a short-term moving average to your asset of choice. Next, add a second, longer-term moving average to the same chart. Observe the points where the two lines intersect. Document these crossover events and cross-reference them with volume indicators to validate the strength of the observed price movement. Always maintain a methodical approach during this process.
Common Pitfalls and Risk Management
One major trap is relying solely on line intersections without considering broader market context. Sideways markets frequently generate whipsaws, where crossing lines produce misleading signals. Implementing strict risk management rules helps mitigate potential losses from false breakouts. Always treat technical indicators as supportive tools rather than definitive forecasts of future price action.